PPG Study Scoring Information
Below is a basic workflow for scoring a PPG study in the EnsoData study management application.
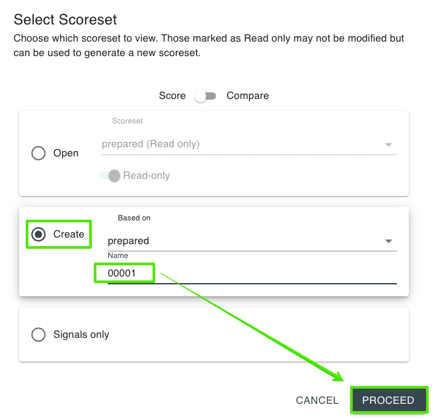
- When opening a study, the user will be directed to create a Scoreset. Select "Create" > based on > "prepared" and enter a scoreset name or number. Click Proceed.
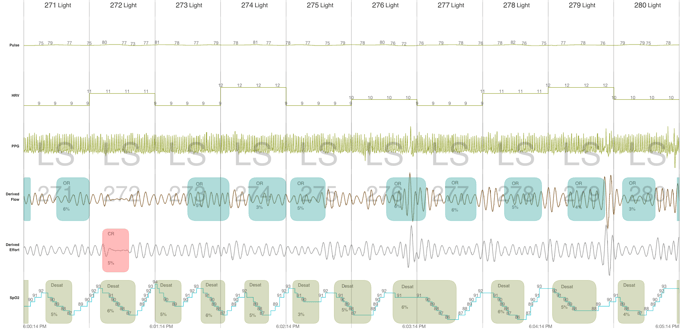
- This will open the Channels window and the user can begin scoring the study.
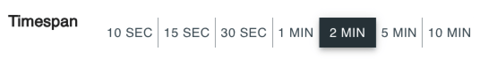
- Edit the viewing window by selecting the settings gear in the upper right, and changing the Timespan at the top.

- Scroll through the study by using the left/right arrow keys on your keyboard, mouse scroll wheel, or the PageUp/PageDown keys.
- To score an event, click and drag on the appropriate channel.
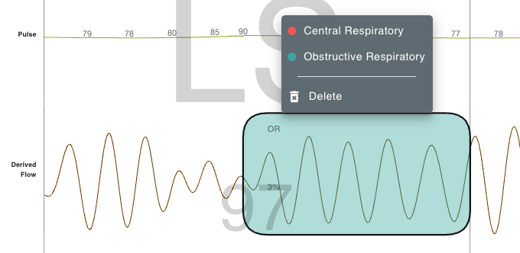
- To change an event, right click on the event and there will be a pop up with event options.
- To delete an event, right click to delete or hover the mouse over the event and click Delete on the keyboard.
- To score bad data on a channel (such as SpO2) press and hold the 'B' key on the keyboard and click/drag to mark a swath of bad data.
- For more keyboard shortcuts, open the Information drawer by clicking the (i) button in the upper right.

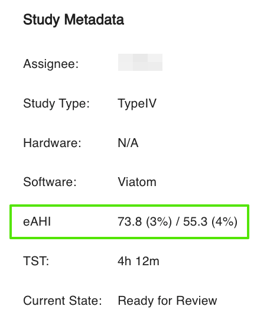
- To get a running total of the current study AHI, select the Metadata list icon.

- Tab Explanation:
- The CHANNELS tab will show all channels present in the study.
- The TRENDS tab will show an all-night event hypnogram with plots for each event type.
- The EVENTS tab will give you a list of every event in the study. You can filter the events to look for specific ones. Click on an event to view it in the CHANNELS tab.
- The PATIENT tab will show the basic patient information.
- The REPORT tab is where users can see the running AHI and other study information associated with the report.